
|
Do you live in a boom town or a bust town? Or maybe the better question is whether you are in a town that is in its boom phase now, or in its bust phase now.
Not every town booms, but every town that booms ultimately busts. That can mean a decline in population, but more often means an end to the growth.
These are important issues in picking where to live, where to establish businesses, and understanding what is going on around us.
First, when I say town, I mean what geographers refer to as an urbanized area: a city or town and all its suburbs. While some city centers like St. Louis and Detroit have gone into steep population declines, much of that change came from people moving from the inner city to the suburbs, so it’s not quite fair to say they “shrunk.”
If you are the mayor of a city or running the fire department, where funding may depend on the population residing within the city limits, then those numbers matter to you. But if you are hiring in a city, building a store in a city, or selling into a city, the urban area population is normally what matters most. In its efforts to make sense of all this, the census bureau defines Metropolitan Areas, which are meant to represent a city and its suburbs.
Definitions for metropolitan areas change all the time, usually every ten years when a new census is taken. New York City merged with Brooklyn in 1899. In following years the population counters had to take into account bigger and bigger pieces of New Jersey and Connecticut when they spoke of “New York City and its suburbs.” And of course some cities have annexed many square miles of surrounding countryside.
So defining urban areas is not an easy task. And it becomes even harder to study growth over time, because you have to try to figure out the population for the same geographical (land) areas in the past that you are measuring today. If you try to do international comparisons – every “census bureau” has its own approach – it gets even tougher.
The fellow who seems to do the best and most consistent analysis of urban populations over time is Wendell Cox, who generously puts all his data – and a lot more great information about cities – on his free website www.demographia.com.
One of my favorite tables on the site is the one where he shows the population of US metropolitan areas from 1900 to 2000, all figured using the 2004 geographical boundaries, so it’s apples to apples. The population statistics used in this post come from this table: http://www.demographia.com/db-met1900.pdf. (In another year or so, the tabulation of the 2010 census will be concluded, adding another set of important data points to this study.)
With all that statistical background in hand, back to the subject: boom towns and bust towns.
I grew up in a General Motors factory town, Anderson, Indiana. I was recently back there for my 40th high school reunion. My mother still lives there. I left there in 1969, as soon as I got out of High School. It was pretty clear to me even then that GM was probably not “the company of the future.” In a town of 60-70,000 people, with over 25,000 GM workers, that was bad news.
When I was little, Anderson had one high school. Another opened in the 1950s, then a third in the 1960s, as GM boomed. A few years ago they cut back from three to two, and now are planning to cut from two to one. This is pretty tough on all of us having high school reunions for high schools that don’t exist anymore.
At the same time, Austin, Texas, where I moved to 28 years ago next month, seemingly cannot build new high schools fast enough. This city has been, for the last several years, a classic American boomtown. Much of that boom is related to Austin’s role as a center for high technology and software.
But it is easy to forget that those old declining “rustbelt” towns like Anderson were in fact “high tech” at one point.
In 1962, GM reached its peak share of the giant US auto market. That same year, the Anderson operations of GM built the world’s largest facility devoted to the research and development of automotive electrical systems. It’s now a vacant building.
In other words, Anderson led an industry segment that in the 21st century is likely to be at the heart of transportation innovation. People in Anderson played key roles in the early development of better batteries and even electric cars. Due to many issues, including management mistakes on the part of GM and an impenetrable artificial wall between “labor” and “management,” that company blew its leadership opportunity in electric cars. But the bottom line is that Anderson today has zero GM employees, and has shuttered over seven million square feet of factory facilities.
I have little doubt that at some future point – hopefully a long way off – technology will also pass Austin by. In the 1980s and 1990s many huge semiconductor (“chip”) plants were built in Austin, which created many jobs. But in 50 years, it is unlikely those chip plants will still be going full strength if at all. Whether it’s because of new technologies invented elsewhere, the decay of today’s leading companies, the rise of robots, or the rise of foreign competitors, Austin’s chip plants are unlikely to last any longer than those GM plants.
For my numbers and charts in this post, I have used nearby Dayton, Ohio, instead of Anderson. Dayton was also a huge GM town and a top high tech town in its day – from cash registers to electric starters for cars to aviation industries. Dayton was really “happening” early in the 20th century. It was larger than Anderson, which makes it more like Austin and also easier to find data for.
I also include Buffalo because it adds yet another interesting comparison – a formerly very important city which boomed much earlier than Dayton, and by the late 20th century had gone into decline – even including the suburbs. Maybe this will happen to Dayton or Austin some day.
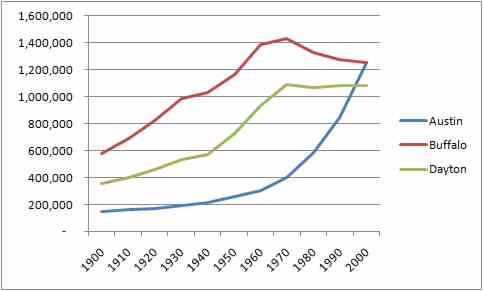
Let me start with a chart that shows the growth of Dayton, Buffalo, and Austin over the 20th century, from the www.demographia.com data. The numbers are the metropolitan area populations, using the 2004 geography.
What we see is that the slope of the curves – how fast they go up when they are going up – is much the same, just at different points in time. It’s obvious that Austin is presently a boom town, but it’s also clear that these other cities had some “hot” years, too.
(And I have to add that since the 2000 census, Austin has shot up to about 1.7 million people, “off the chart” above.)
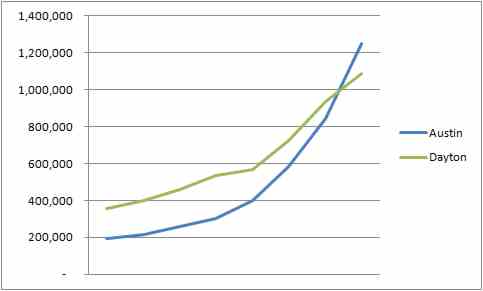
To bring the similarity of the curves into clearer perspective, I have in the next chart lined up Dayton’s growth from 1910 forward with Austin’s growth from 1930 forward. That is, this compares Austin’s population 20 years after Dayton’s.
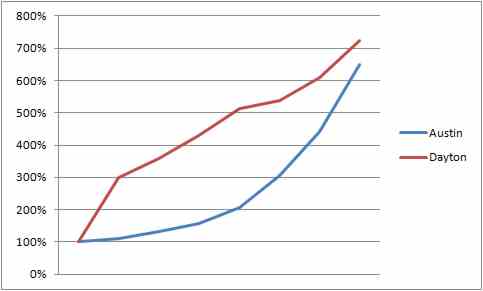
Here we can see that the curves of the two cities are amazingly alike. This becomes even more clear if we set the two curves to the same starting point by using an “index” (setting Austin’s 1930 population to 100 and doing the same with Dayton’s 1910 population, and then showing later years as a ratio to that common starting index of 100). See the next chart.
Over the period from 1930 to 2000 Austin’s start and end looked a lot like Dayton’s curve from 1910 to 1980. In between, however, the curves looked a lot different. Dayton had relatively steady growth, whereas Austin really accelerated in the last 30-40 years.
So what are my points?
1. It’s important to know whether your city is growing or shrinking. If nothing else, that point alone is worth remembering and acting on.
2. It’s important to know that about every market where you operate or sell things.
3. The patterns are often the same as patterns in other places or at other times (more graphs might show us that even Austin looks sleepy compared to Orlando or Las Vegas – at certain stages of their growth).
4. Studying growth patterns can teach us a lot about where we are at and where we might be headed. The same type of analysis used here might be applied, for example, to Google in recent years compared to Amazon or Microsoft at an earlier date, or even General Motors or the Pennsylvania Railroad at dates further back in time. The rise of the Internet – past and future – may best be understood by looking at the rise of the telegraph or television. The curves of life and the arcs of enterprise are important but little used and understood tools for grasping the world around us and achieving wisdom.
|